The story of how DNA sequencing replaces the food diary, and what it still cannot see
Isha Mehta, Ph.D.
September 2026
(8 Minutes)
Imagine a town that made its commercial decisions, the ones with consequences for equity in food availability, based on evidence instead of surveys.
- What is the best day and time to hold the farmers market so all the households could benefit from them equally?
- Where to place a grocery store, and how many, so people are spending time making actual dietary choices and not driving?
- How to stock the shelves once the store existed, to conveniently place foods people would actually cook and eat regularly?
Because these decisions are based on evidence rather than surveys, questionnaires, and summarized purchase records, everyone benefits from it, irrespective of whether they filled out forms or belonged to neighborhoods with the least political leverage. Purchase records are no better than surveys, since people may buy things they never get around to eating, and those things end up in the trash. Grocery receipts also miss restaurants, school meals, and dinner at a neighbor’s house.
This town runs on a measurement that, until recently, did not exist anywhere.
A different instrument
The alternative David’s lab built rests on something almost embarrassingly simple. Food is made of organisms. Organisms have genomes. Digestion does not destroy all of that genetic material. So stop asking people what they ate, and sequence what is left.
The method is DNA metabarcoding, borrowed from ecology, where it had long been used to reconstruct the diets of wild animals, who are also unwilling to fill out questionnaires. Rather than sequencing whole genomes, metabarcoding amplifies one short, standardized marker region that differs reliably between species, then matches the reads against a reference library. It answers “who is in here,” not “what is their full genome.” The platform, FoodSeq, uses two markers: the P6 loop of the chloroplast trnL intron for plants, and the V5 region of mitochondrial 12S rRNA for animals. Short markers matter because food DNA arriving in stool has been cooked, chewed, and digested; a short fragment survives that, a long one does not, the same logic forensic and ancient-DNA work runs on.
It did not work at first. The 2019 proof of concept, in eleven people, had roughly a fifty percent PCR amplification success rate, and the trnL marker could not always tell closely related plants apart. What followed was the unglamorous part: marker optimization and building a reference library of food genomes, because you cannot identify a mung bean read without knowing what mung bean looks like in sequence.
Scaling to a community signature, at under a cent a person
In July the lab published FoodSeq-FLOW, for Food Landscape Observation in Wastewater, in PNAS. Getting there took a collaborator with something David’s lab lacked: sewage. Rachel Noble at UNC Chapel Hill had spent 2020 running North Carolina’s wastewater surveillance for SARS-CoV-2, and had the sampling network and archived samples. Duke had the dietary platform. Mengyi Dong, then at Duke, led the genomic analysis.
The study drew on 183 samples across 21 treatment plants, representing roughly 2.1 million North Carolinians, and detected 184 plant and 116 animal food taxa,highly similar results from 14 paired stool samples collected in Durham for validation.
A sequencer reports a list of taxa and read counts. Everything interesting happens after that. The team linked those plant and animal DNA patterns to demographic and geographic variables, using multivariate analysis to separate seasonal, socioeconomic, and cultural signals that all arrive tangled in the same sample, so a summer produce signature is not mistaken for an income signature.
What we now know:
- Hops and barley, the primary ingredients in beer, were among the strongest food-DNA predictors of higher community income. The sewer can apparently tell who is drinking craft beer.
- Areas with larger foreign-born populations showed stronger signals from tropical plants and pulses: mango, palm or coconut, mung bean, black gram, chickpeas, pigeon peas.
- Coastal communities carried locally caught species including drum, Spanish mackerel, and triggerfish. Inland cities leaned toward widely distributed farmed fish, Atlantic salmon and tilapia. Noble, who lives in Beaufort and fishes locally, recognized species in her own community’s sewage that appeared nowhere else in the state.
- Sampling across two time periods (seasons) captured produce shifts tracking local availability.
There are no questionnaires, no food diaries, and no requirement that people volunteer or remember what they ate. The unit of observation is the community, not the individual. And much of the infrastructure already exists: wastewater surveillance networks built during COVID could be repurposed, at scale, to measure nutrition instead of a virus.
Evidence-based decisions in Durham
The town at the top of this article was hypothetical. This part is not.
Durham’s historic Hayti neighborhood has been described as a food desert. Local leaders there are working to bring in a Black-owned full-service grocery store, and they believe this kind of data could help demonstrate the impact such a store would have. Erin Dooley, co-founder of BLK South, said what is unusual about the research is that it “supports our lived experiences,” not just hard facts.
Hayti residents did not need a sequencer to know what they eat. They needed something an institution would accept as evidence. That cuts both ways. David has openly made the commercial case too, coastal seafood signaling opportunity for fisheries, low produce signals flagging access gaps for grocers, and in the same breath said he wants the data to support communities rather than be “appropriated in a way that could harm the health of a community.” The same dataset serves both purposes, and the caution came from the senior author, not a critic.
Where it goes next: the team is narrowing from statewide sampling down to individual Durham neighborhoods, and talking with community leaders about whether this kind of evidence can strengthen the case for grocery stores and other food resources where they are currently lacking.
A record of exposure is the missing baseline for preventive nutrition
The community scale works today. The individual scale is where this matters for prevention. FoodSeq’s native sample is stool, and its appeal there is that it asks nothing of the person: no remembering, no logging, just measurement from the fact of eating.
What it hands you at that scale is a record of exposure: what actually entered a body, not what that body went on to do with it. Exposure is also the modifiable half of the equation, which is what makes it worth measuring well. A cheap, objective readout of it is the input variable that fifty years of questionnaires have only ever approximated.
This is where I read the work a little differently than most. As someone drawn to preventive medicine, I see the missing baseline measurement that preventive nutrition has never had, one precise enough to eventually help design region-specific dietary regimens against conditions like type 2 diabetes or fatty liver disease, instead of applying the same generic advice everywhere and hoping it fits.
Diet is not nutrition
The sharpest limitation, and one David states plainly: the method sees ingredients, not nutrients. Fortified bread shows its wheat and sugar, because they carry DNA, but not the added iron or B vitamins, because they never did. Quantification is relative, not absolute; you can tell a species is more or less abundant, not how much anyone ate. Some foods, like broccoli and cauliflower, are genetically too similar to separate yet. And septic systems are invisible to it, which means rural populations, already underrepresented in dietary research, are missed again. Noble calls this a real disadvantage of the study.
Each gap maps to active work: second-generation assays for species resolution, faster turnaround, personal reports at the individual level, and a reference database that keeps growing, so every food properly sequenced once becomes identifiable by everyone after. A method that measures something previously unmeasurable tends to travel beyond the lab that built it, and FoodSeq is already showing up in nutrition, epidemiology, ecology, and public health well beyond Durham.
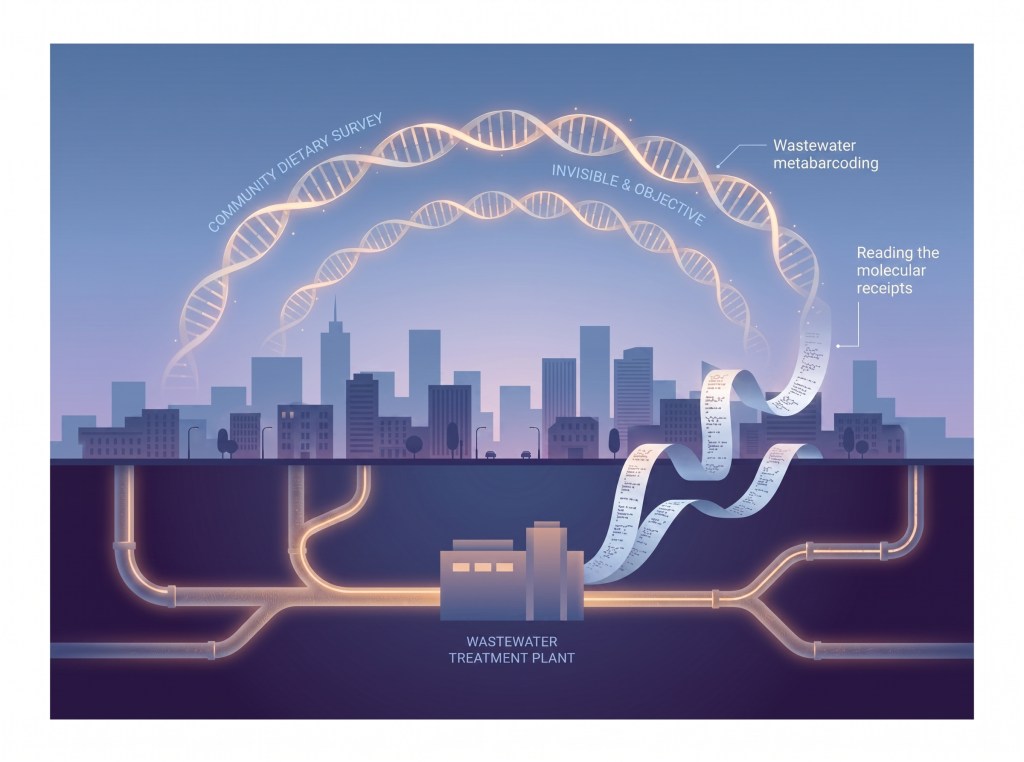
FoodSeq began as a way to stop trusting our memories of what we eat. FoodSeq-FLOW makes a bigger proposition: a community’s diet leaves a molecular paper trail, written in DNA and flushed down the drain.
Nutrition science spent fifty years asking people to remember. Now it is learning to read the receipts.
References:
1.) Dong M, Clerkin TJ, Jiang S, Ives N, Osborne OW, Kirtley M, Bauer AE, Anderson KY, Smith MD, Noble RT, David LA. Dietary DNA in municipal wastewater reveals signatures of wealth, immigration, and coastal proximity. PNAS 123(31), July 20, 2026. doi:10.1073/pnas.2530704123
2.) Reese AT, Kartzinel TR, Petrone BL, Turnbaugh PJ, Pringle RM, David LA. Using DNA metabarcoding to evaluate the plant component of human diets: a proof of concept. mSystems 4(5), 2019. doi:10.1128/mSystems.00458-19
3.) Superdock DK, Petrone BL, Kirtley MC, David LA. From stool to sequence: decoding the human diet with FoodSeq. mSystems 10(7), 2025. doi:10.1128/msystems.00158-25
4.) Duke University School of Medicine news release, July 20, 2026; North Carolina Health News / Coastal Review, August 2, 2026; Nutrition Insight interview with Lawrence David; The Analytical Scientist.


Leave a comment